

Covid-19 Hub
Goal
A ground-breaking product that provides timely evidence-based, location-based specific information about Covid-19 cases in our community, all the way down to the county level.
Role
Product Designer
Softwares
Sketch | Invision | Mapbox
Duration
Mar 2022 - October 2022


During the start of the Covid pandemic in March 2020, I was selected as one of the four designers to be a part of this monumental pop-up squad that was formed overnight. This is one of the most challenging projects I've ever worked on in my career, and I got to work with third-party contractors like the award-winning team at Mapbox. The data on this sensitive subject matter was very complex, and The Weather Channel helped by providing this trusted source to everyone.
Overview

The Problem
It was March 2020. The pandemic had just begun and there was so much misinformation floating out there. People needed a trusted source to go to for actual facts, not just speculation. The data on this sensitive subject matter is very complex, so we wanted to help by providing a trusted source to everyone by leveraging our weather data.
The Solution
County-level Data
Easy-to-understand Graph
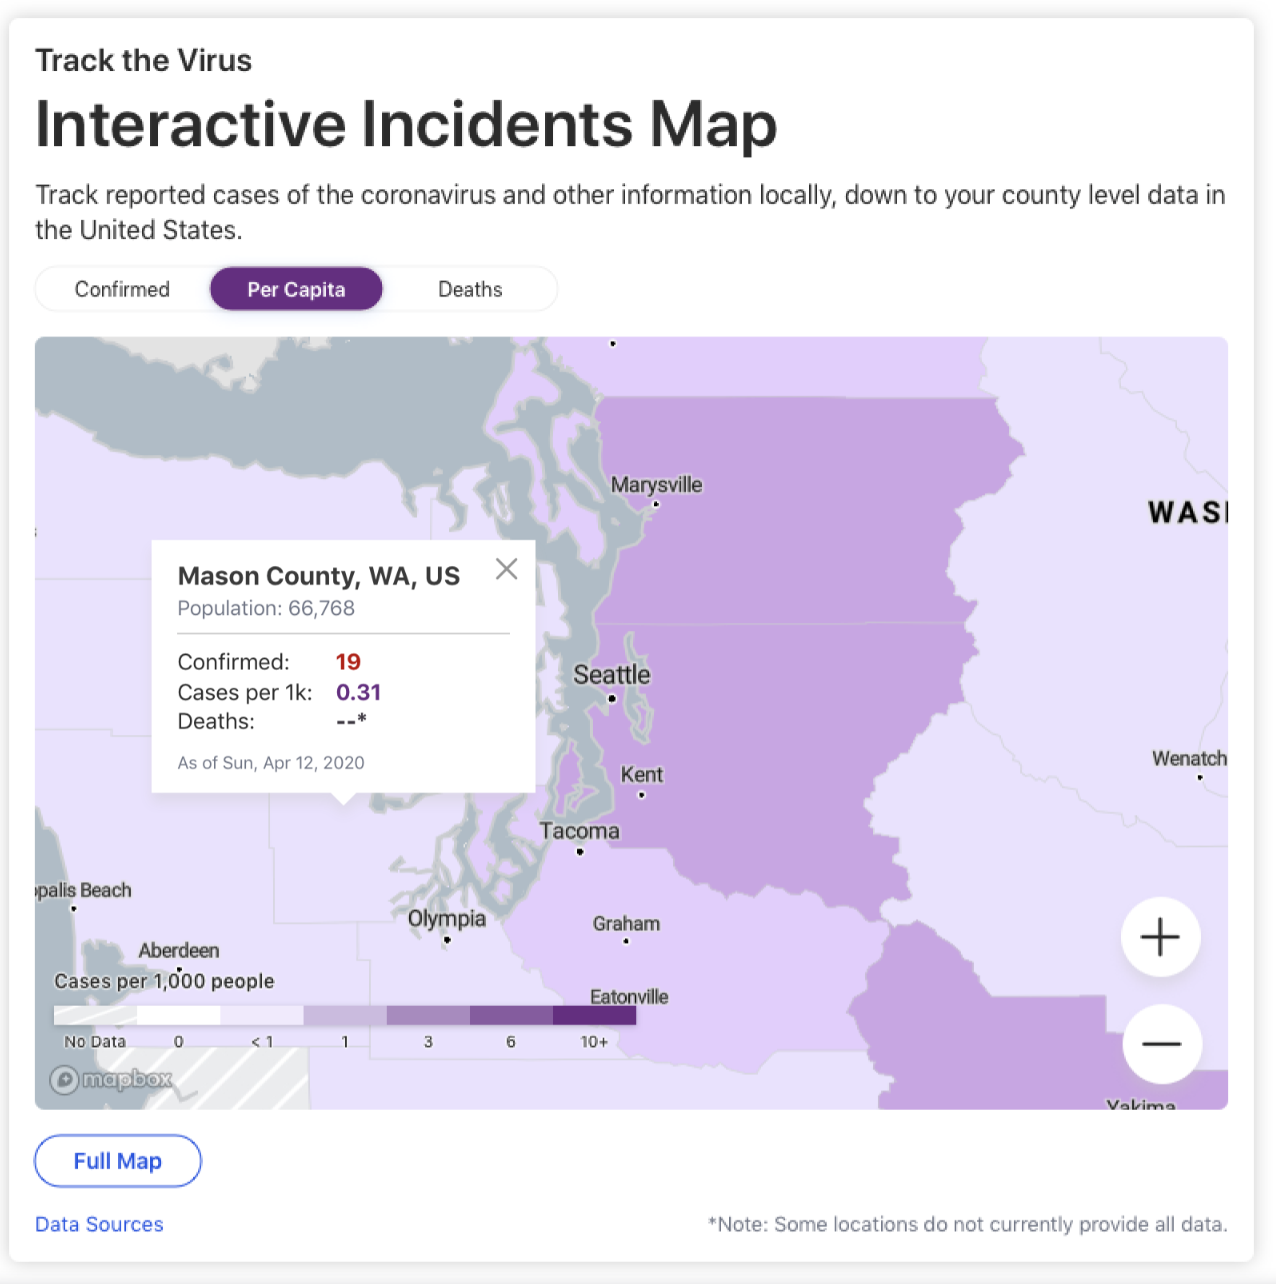
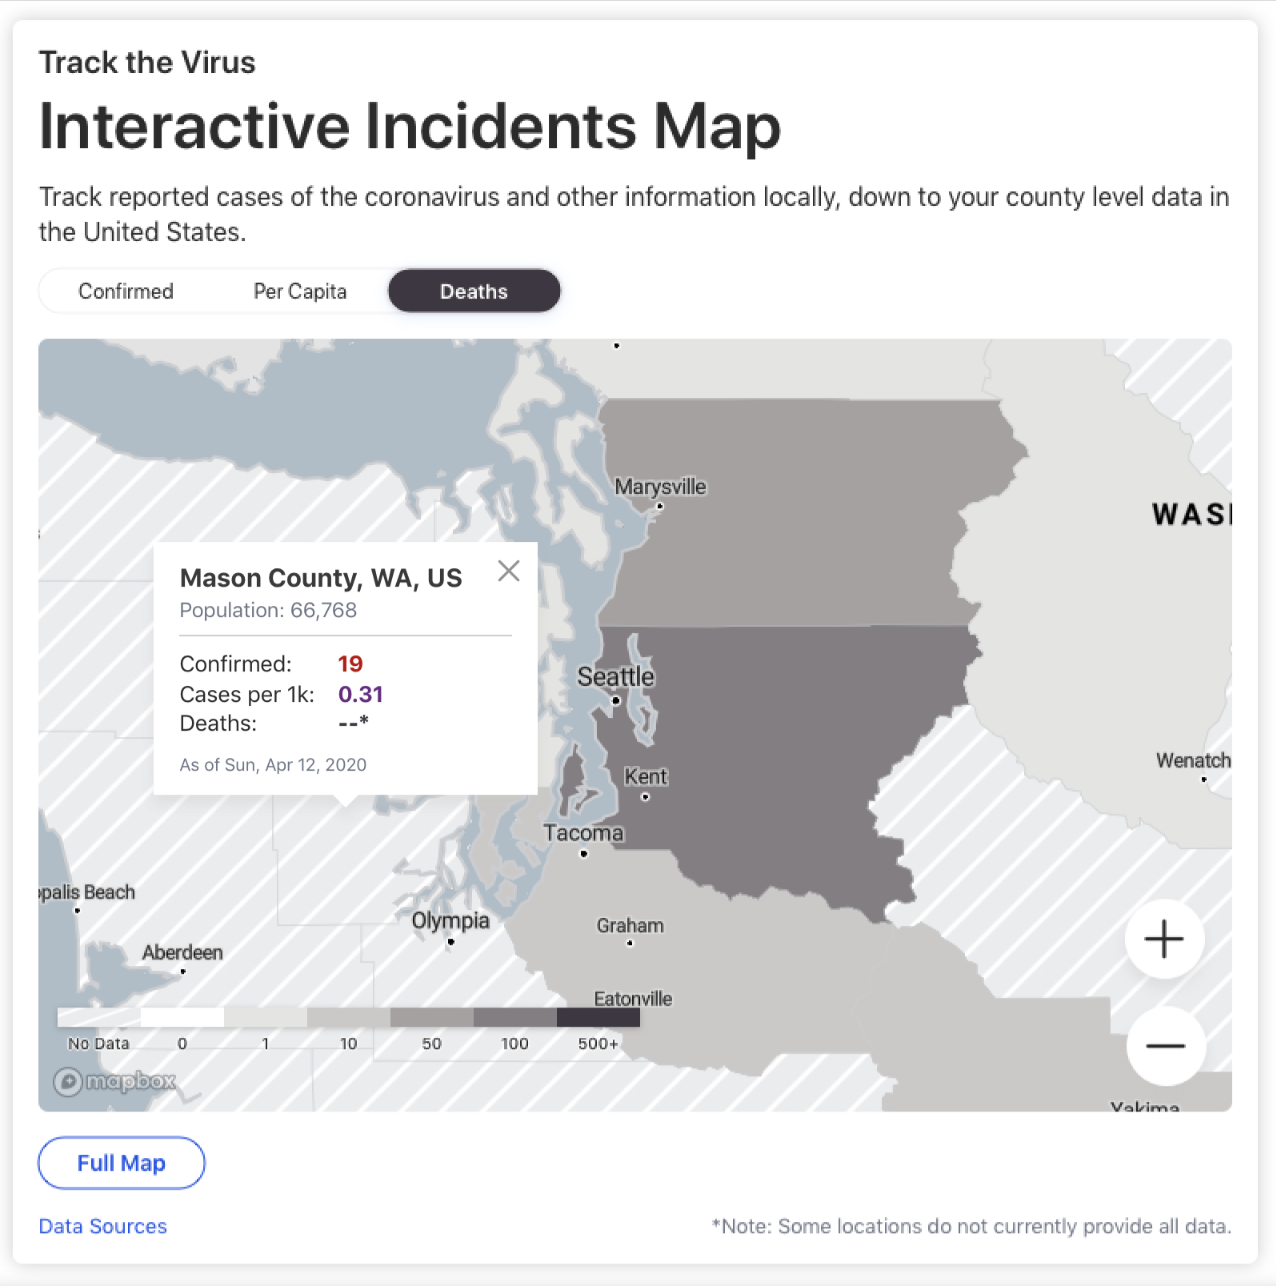
Interactive Map with Cases Data
Watson Advertising Chat Bot

Interactive Map Process
We categorized the data available on our interactive map into three categories of cases: Confirmed, Per Capita, & Deaths.

Process
I worked with our in-house data teams: SUN and Pangea, who are responsible for the data on our Weather Channel maps.
I worked with our third-party collaborator Mapbox to figure out the colors we would use. for the type of cases + the look and feel of our new map.
The lead designer and myself worked together with our engineering team to come up with the map you see live today.

“Good data by state and county. Nice job on the Covid 19 map. Would be great if you have an option for it to expand to a full page. I view it on a tablet.”
— A TWC User. We are always incorporating user feedback in our products.

Working with Mapbox
Known for their award-winning work on Hasan Minhaj’s popular Netflix show Patriot Act, I had the incredible opportunity to work with Mapbox’s in-house team to arrive at the perfect Covid data map.
We worked together on choosing the right color to represent different types of covid cases and made sure to keep accessibility in mind.
I learned how to use Mapbox Studio and work with our Engineering team to integrate the Mapbox skin into our code.
Through trial and error, and real-time collaboration, we created the seamless map you see today.
Translations
We began with US only, then slowly released in Great Britain, India, Germany.
I worked closely with our in-house translation team to make sure our designs render into other languages.
I provided mockups to help devs understand which locations can display only certain modules.


Highlights
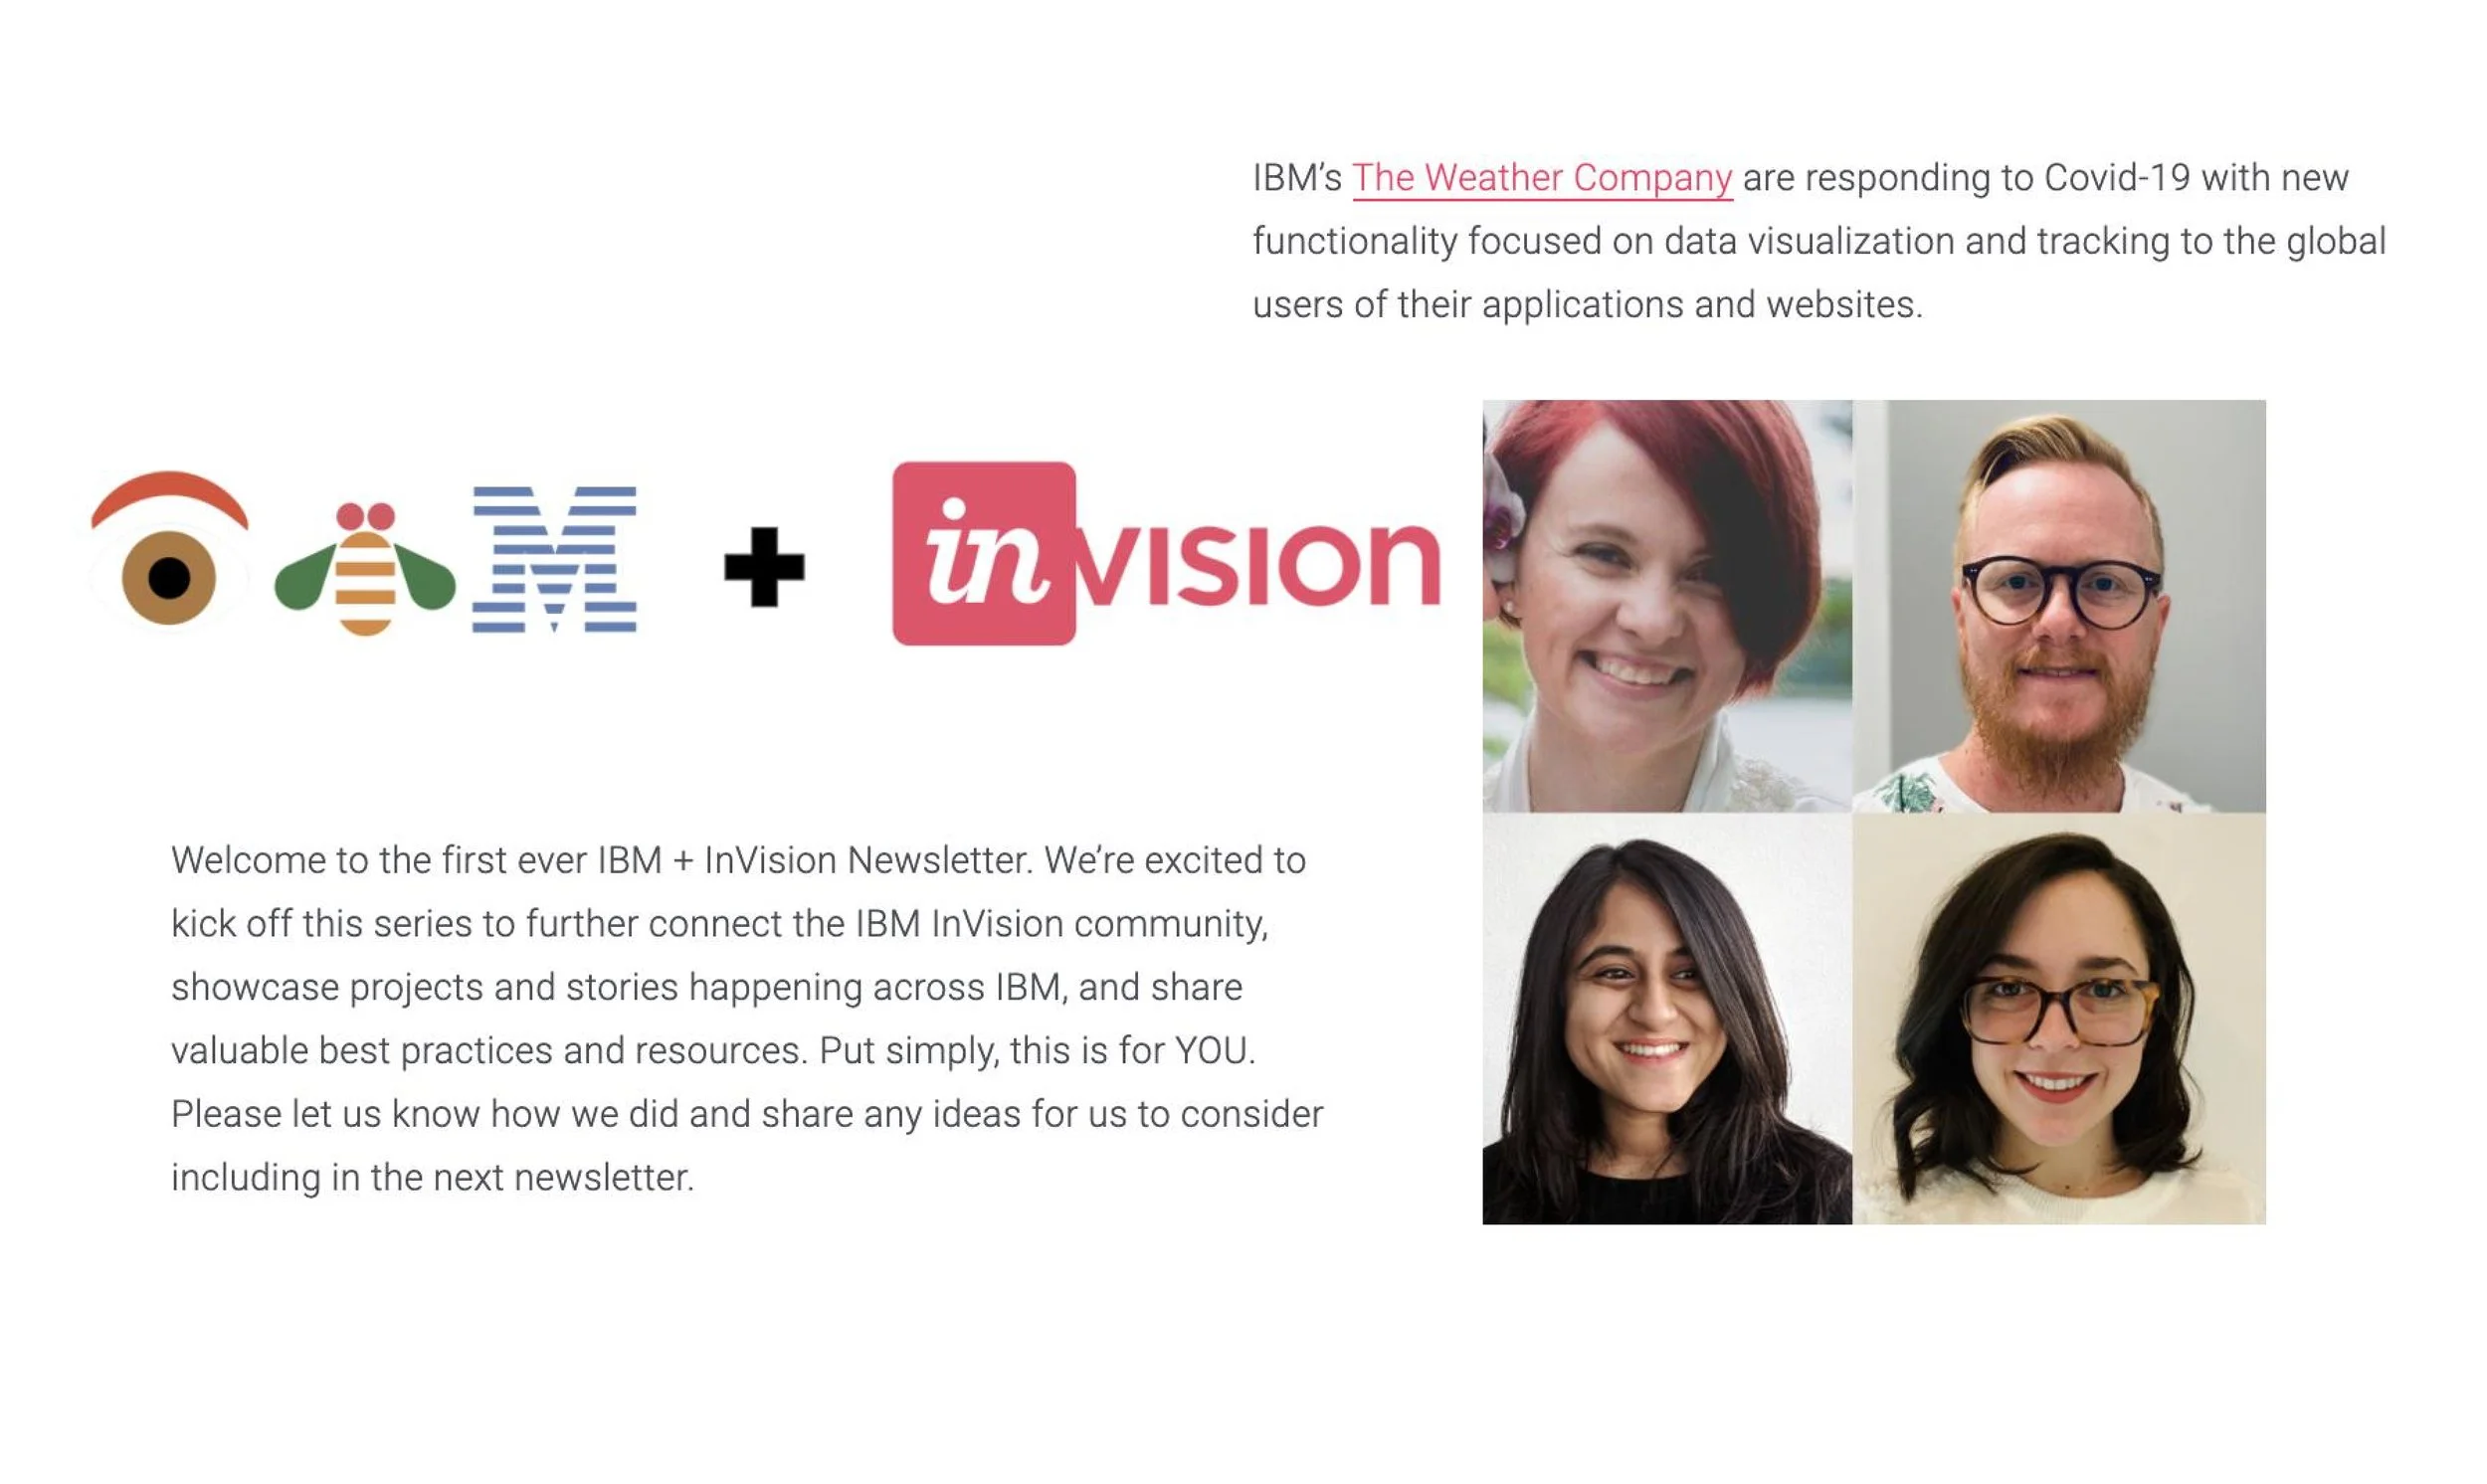
Probably one of the major highlights of my career was getting to be on a surprise call with then IBM CEO Ginni Rometty! She was such a big fan of our work at The Weather Channel that she spoke about us on CNN. Our small but mighty design team was also featured in IBM +InVision's first-ever newsletter. As UX designers, Invision is an integral part of our job and made collaborating on this Covid project so much easier. Grateful for moments like these at my job.

Takeaways
I learned to work under a big time crunch, be flexible, and collaborate with not only other designers but also with other teams like Marketing and Engineering. I also had the opportunity to collaborate with the folks at Mapbox as well as the Sun team, and get insight into what it takes to design maps.
As someone who has always been an advocate of "design for good", I was very grateful to be a part of this endeavor. It has always been my mission as a designer to "design" the change I want to see in the world and to be able to make a difference and work on an app that has 45 million users was a dream come true. What I loved the most about what we created is that it was innovative and user friendly, and much-needed in the unprecedented times we live in.
